最新产品
| 品牌 | 美国IITC | 型号 | 15 |
产品介绍:

EEG activity during and after stimulation with blue (445 nm) and deep red (660 nm) light in the same animal Stimulation parameters:20HZ ,5ms,20s(10% duty cyc1e);600mA;LED probe intensity:Blue:130mW/mm2; Deep red:155mW/mm2
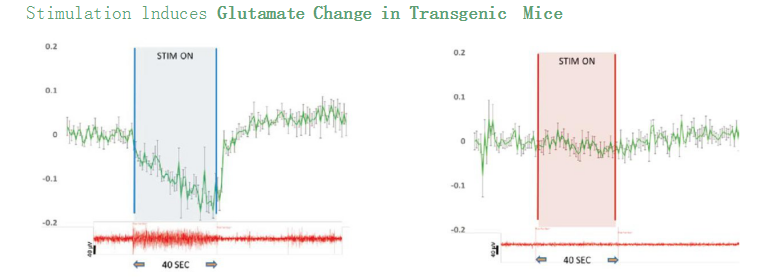
Average change in extracellular glutamate concentration in the frontal cortex a 40s stimulation (20 Hz,10% duty cyc1e,600 mA) with blue (445 nm) and deep red (660 nm) single light in the same animal (n=5). Representative EEG depth electrode activity is plotted during time of stimulation.
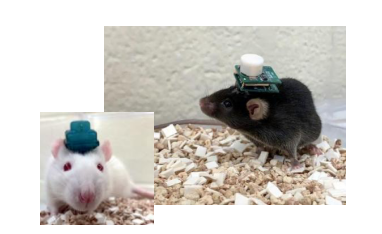
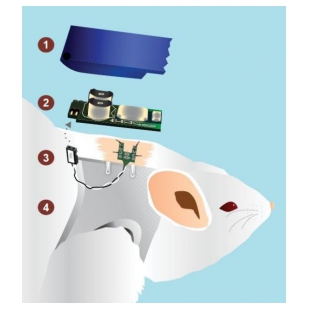
在体无线脑电肌电监测
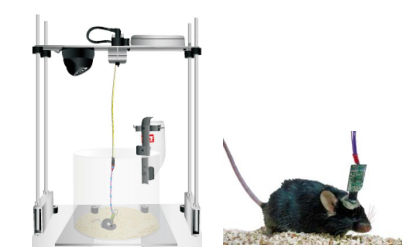
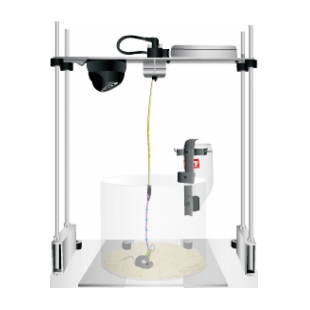
在体有线脑电肌电监测
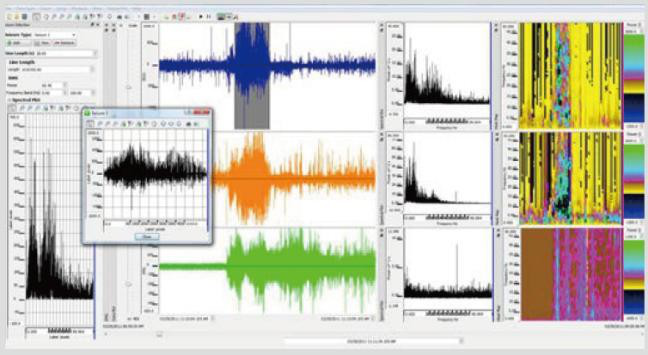
癫痫分析软件
快速识别和分析用户定义的癫痫事件。可生成和统计密度图、峰值频率、热点图、line length、癫痫持续时间、间隔时间等
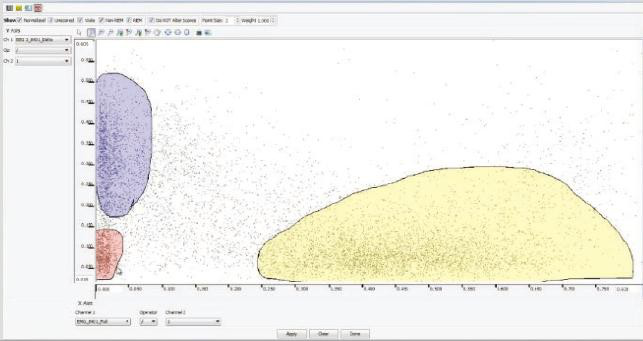
睡眠专业分析软件
三种睡眠评分手段: 手动、半自动对清醒、非快速眼动睡眠和快速眼动睡眠时间进行评分。方法包括:聚类评分
(Cluster scoring)、阈值评分(threshold scoring)、睡眠图(hypnograms)、波谱图(spectral plots)等 。

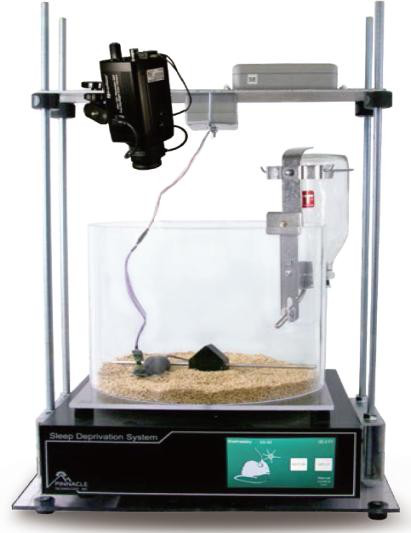
睡眠剥夺系统
支持长期、短期睡眠剥夺模型建立,可提供灵活的日程控制式;支持EEG/EMG反馈控制调节;具有触屏调节和软件控制等操作模式
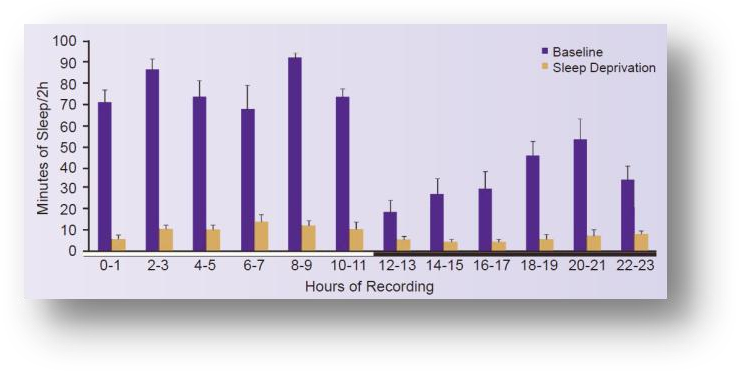
The chart above shows a comparison of baseline sleep (purple bars) with a 24-hour sleep deprivation period (gold bars).
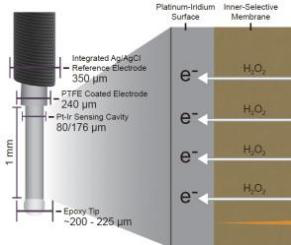
生物酶传感器
可用于检测脑内谷氨酸、乳酸、葡萄糖
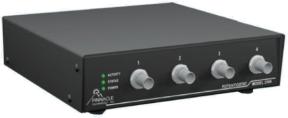
4-通道恒电位仪
用于麻醉动物、脑切片和其他体外化学物质检测
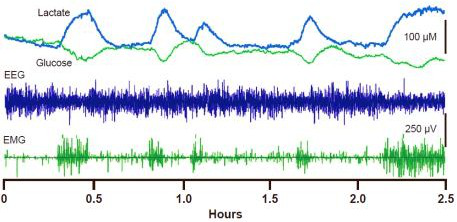
Lactate & glucose Biosensors. EEG and EMG waveforms are plotted simultaneously with calibrated biosensor traces for lactate and glucose recorded from a single animal

快速扫描循环伏安检测系统(FSCV)
在体进行大小鼠清醒状态下脑内多巴胺/5-HT/去甲肾上腺素/腺苷的浓度变化监测
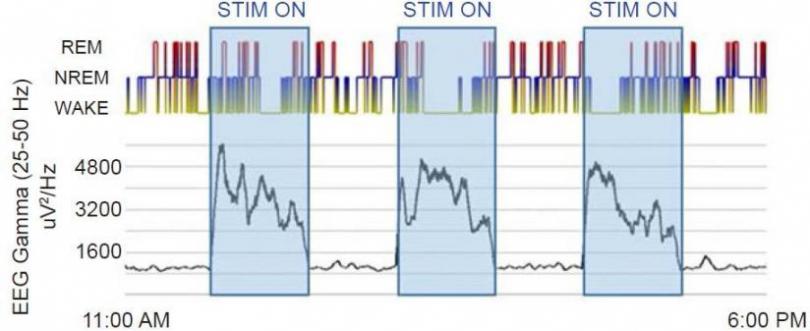
Sleep activity ( top) and EEG Gamma power (bottom) plotted during three periods of 1 hour optogenetic stimulation.
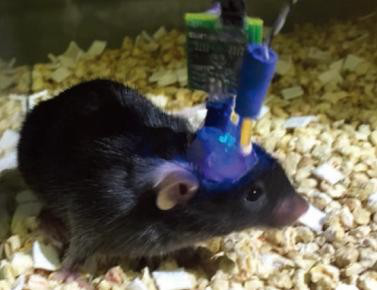
光遗传系统
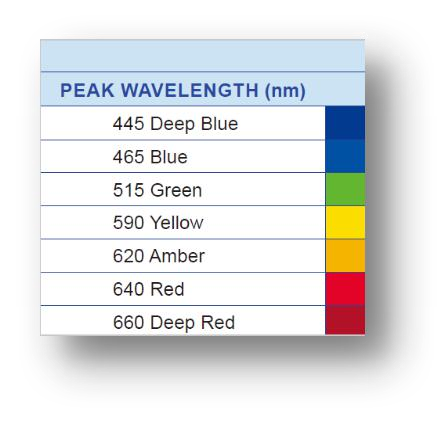
7种波长的光线探针可供选择,满足不同实验需要
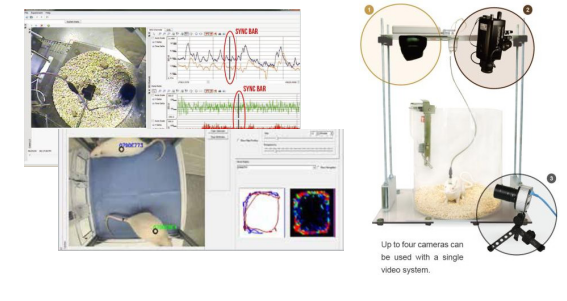
视频采集及轨迹分析系统
象限分析
运动轨迹分析
用户自定区域
距离速度图表
活动密度图
多动物IR tag追踪


